Virtual Reality
VR/AR Considerations
The use of virtual reality in meteorological education should be a means to an end and not an end itself. To determine whether VR would be a valuable tool for a concept or series of concepts, the educator and/or developer can answer a series of questions.
1. Is the concept highly three-dimensional and unsuited for a plan view?
There is nothing wrong with simple figures on a textbook page (or e-reader) if the motion or structure being illustrated is entirely in one horizontal or vertical plane. A simple program can also add a high amount of interactivity, such as the now defunct Riverside Scientific Inc. Seasons, Winds, and Cyclones programs. On the other hand, while an illustrater can attempt to use the classic dots and x's to show motion in and out of a page, it would be far better to take advantage of a third dimension.
2. Is it beneficial to be able to quickly manipulate multiple viewing angles?
Using perspective, an illustrator can give the illusion of three dimensions to a 2D figure, but from only one angle at a time. A 3D computer graphic on a standard computer monitor or smartphone screen can be rotated to different viewing angles, but the controls involved can be somewhat clumsy and take time to adjust ideally. On the other hand, using augmented reality, a three-dimensional object held in the user's hand is quite simple to manipulate to see all the important components and how they may be interacting with each other.
3. Is immersion inside the scene intuitive to users?
While meteorology students will become used to seeing pressure/height surfaces and isosurfaces of fields like wind speed and vorticity, this familiarity is as an observer outside of the entire scene being shown. Looking at a typical display of thermal wind balance from the inside is likely to be more confusing, and thus more suited to AR than to VR. On the other hand, cloud structures (and similarly isosurfaces of relative humidity) are part of everyday experience, and thus, would be useful to include in a VR display.
4. Are many of the concepts being shown linked to each other spatilly?
While a single phenomenon may be equally well-suited to be shown in VR, AR, or more low-tech formats, if several phenomena occur in predictable locations relative to one another then there can be an advantage to virtual reality. To be more truly immersive, better VR programs allow for the user to change their location within the environment, often one which is much larger than the area a person could actually cover on foot. Traveling from one educational module to another is a good application of this, even if the lessons at each point could be handled as well outside of the computer generated world.
VR & Field Campaigns
Virtual reality environments should contain a large amount of three-dimensional information for the user to view and, preferably, navigate through. The relative ease of accomplishing this using numerical model output would tend to lead developers in this direction, but meteorological VR worlds should not neglect the use of actual observational data. While operational weather observations are too coarsely spaced to be viewed together over a small area, there have been a number of special field projects over the years that produce dense 3D datasets for a variety of phenomena, many run by NCAR's Earth Observing Laboratory.
Visit the directory for all of Earth Observing Laboratory field programsThe output from mobile radar units, which see particularly large usage during projects studying convective weather, is most often viewed as disconnected 2D images. However, using the azimuth and elevation data these planes can be placed in the same 3D space as other field observations. Multiple RHI's would be particularly easy to view for a VR user moving through this area. The Plains Elevated Convection at Night (PECAN) experiment (Geerts et al. 2017) is a good example of the deployment of several radars in formations to scan in an overlapping manner. Radiosonde launches would also occur during these events, and the insertion of 3D profiles into the scene is simply handeled by a series of rectangular solids color-coded by appropriate variables. After an initial fourteen line object, each subsequent segment if only ten lines each (Billings et al. 2017).

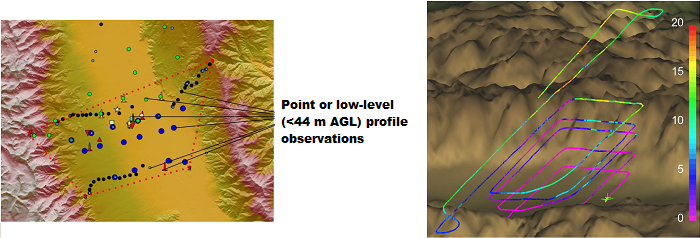
The Terrain-induced Rotor Experiment (T-REX, Grubišić et al. 2008) was designed to study mountain wave and rotor activity in Owens Valley, California to the lee of the southern Sierra Nevada. While the study area included a micronet of surface stations, temperature loggers, and soil moisture sensors, there was also dense coverage by instruments with results that can be rendered in a 3D display. These include three 44-m flux towers and two boundary-layer wind profilers, two radiosonde sites, one aerosol lidar and two with Doppler capability, and up to three research aircraft at different levels.
As the project was still ongoing, the in-situ data from these flights were being visualized in IDV using aircraft symbols for the current location and colored tracks of a previous number of minutes (Billings et al. 2017). These displays would work well in a virtual reality world. In a similar manner, data from dropsondes deployed from the higher two aircraft could be seen as they were falling (or run in reverse), and scan planes from a dual-doppler radar on the lower aircraft could appear in the appropriate space at intervals underneath of the track.

VR & Mountain Meteorology
Phenomena studied in the field of mountain meteorology can produce familiar visual weather which would justify the use of an immersive VR environment, including heavy orographic snowfall or rainfall, lenticular and roll cloud formations, and trapped layers of fog, smoke, or pollution. The larger-scale airflow and smaller-scale microphysics which control this weather, on the other hand, are more easily visualized using an AR-type framework, but the fact that these events occur at different locations relative to the topography still justifies a virtual reality world. Indeed, VR programs frequently include a user toolkit, and a cube which could also be used for augemented reality could still work inside a simulated world.
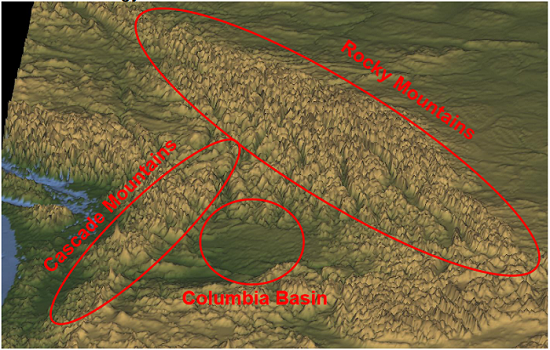
One of many ways to divide the subjects of mountain meteorology is to consider concepts as: 1) upslope/upwind, 2) downslope/downwind, and 3) enclosed valleys/basins. For ease of travel in VR, these three regions should all be located a relatively short distance from each other. This could be done by having a large, linear mountain range separating areas 1) and 2) in the northern half of the domain. In the southern half, a second mountain range could intersect the first at a 45-90 degree angle creating a large interior basin (3) if higher terrain also exists to the south. Such configurations can be found in actual topography, such as the area from Washington to Montana and southern British Columbia to southern Alberta, which includes the Rocky and Cascade Mountains and Columbia Basin as described prior (Billings et al. 2016).

