Augmented Reality
AR Forecasts
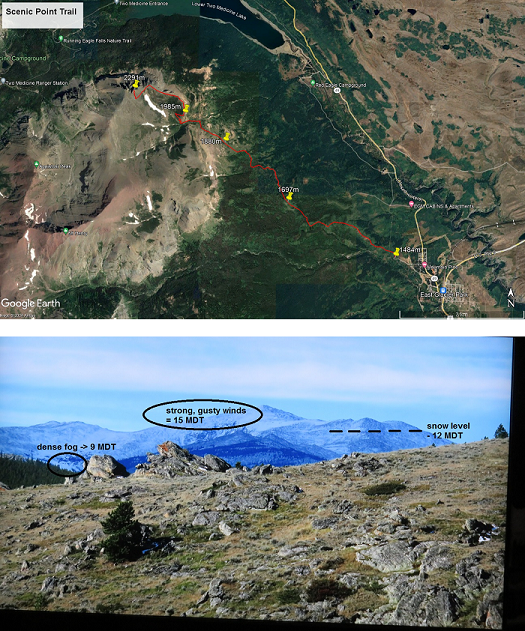
While many of the better-known AR applications display animated, three-dimensional graphics, a simple textbox with a 2D background can be of great value if it displays information relevant to what the user is seeing in real life. These could be in the form of driving or walking directions or information on historical sites, both of which require only a phone's GPS and compass data. If a more specific point in the camera view needs to be labeled, this can be accomplished by providing a silhouette to match to elevated landmarks. An example of this is the PeakVisor app which labels the peaks of mountains with name and elevation.
While some apps can show animations of the type of weather forecast at the user's current location (e.g. rain, snow, fog), there are no forecast products which display information at a remote point in the camera view. Over flat land this may not be a useful feature, but in the vicinity of elevated terrain these points may be located at an elevation or exposure that results in significantly different weather. A user group which would especially need this type of information would be hikers. For example, even the relatively simple Scenic Point Trail in Glacier National Park rises from 1484 m ASL on the edge of East Glacier village to 1880 m ASL before exiting the tree line. Beyond that the trail continues to rise in a switchback fashion to a peak of 2291 m where hikers can descend on the other side of the mountains down to the Two Medicine area. Temperatures, humidity, wind speeds, visibility, and precipitation can all vary by large amounts over this 807 m elevation gain.

The simplest such AR forecast product could simply display interpolated model gridpoint forecasts at the appropriate heights along a set of trail GPS coordinates. However, users may also value more subjective descriptions of potentially adverse weather conditions with dividing lines or outlines showing what elevations, ridges, valleys, or up- and downstream distances they may occur. Of course, the technical programming is only part of the challenge of developing such an app, due to the difficulty of forecasting in complex terrain (Chow et al. 2013). The most successful application would likely require human forecasters with an understanding of the most important phenomena affecting hiking conditions and the physics causing them, which may require future research projects to determine (Colman and Dierking 1992).
Merge Cube
Many augmented reality graphics are triggered using image recognition subroutines. Two-dimensional graphics like on magaine articles, movie posters, and business cards can then be transformed into an object with depth and motion. Cherukuru et al. (2017) give an example in the atmospheric sciences. While images on a plane surface will lose tracking when they are rotated, at least four faces combined into a geometric solid allows users to manipulate the orientation of the AR product.
Merge Labs markets one such example known as the Merge Cube. The cube itself is a simple foam covered with intricate and unique designs on each of the six sides, while the Explorer and Object Viewer apps allow users access to the graphics which a camera phone will overlay on the cube. The phone can either be held in one hand or placed in low-cost glasses so that both hands can be free and stereo viewing can make images more three-dimensional. The educational emphasis of the Merge Cube the ability for students to hold three-dimensional objects in their hands, and many of the objects have labeling of the individual parts while some can also change depending on how they are oriented.
Initially, Merge provided software development kits for third-party developers to create their own applications which worked with the Merge Cube. Unfortunately, this support had been discontinued, but one of the most prominent of these external apps is still available through the Merge website. HoloGlobe consists of a three-dimensional sphere which is overlayed by real-time satellite imagery of various NASA products (Moore et al. 2018). While additional viewing modes have been added, the user can still hold a current picture of the earth in their hand using Merge Cube.
Download HoloGlobe for Android or Apple.MountainMetCube
The field of mountain meteorology is well-suited to three-dimensional graphics, because there are a number of phenomena where the vertical airflow over complex terrain affects the resulting airflow in the horizontal. For this reason, development was started on a Merge Cube program called MountainMetCube (Billings and Dorofy 2018). Future work may transfer the basic program to use more generic image recognition and reference objects.
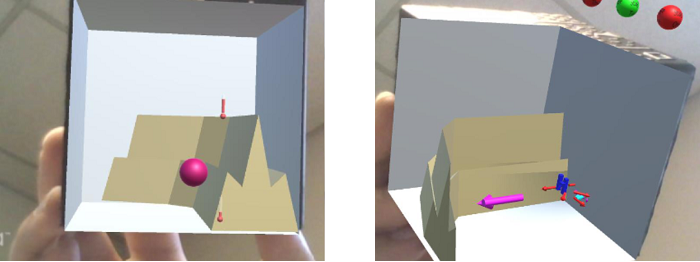
The first of three modules focuses on island wakes and is based on Figure 1 of Smith et al. (1997), so the computer-generated island can be resized to short, medium, and tall heights, with the tallest islands divided into narrow and wider widths. For the four types of mountains, users can toggle three types of display: a surface wind field, a vertical cross-section of isentropes and wind speeds, and three dimensional cloud fields or satellite orientations. The shortest mountains will show uniform surface winds (no wake) and trapped lee waves with lenticulars extending along two beams downstream of the barrier.
The medium-heigh island shows the beginning of wave breaking in the cross-section, and the resulting loss of momentum is seen as lower wind speeds in the island wake, but without any directional changes. Instead of clouds, a computer-generated sun and satellite illustrates how Smith et al. (1997) used sunglint to visualize these lower winds. For the tallest islands, the isentropes are largely horizontal since flow is mostly around the obstacle. For the narrower case, surface streamlines outline a Von Karman vortex street, and the characteristic clear circles are in the cloud field. Finally, the wider island has the closed streamlines of a steady eddy, with a line of cumulus clouds extending downwind.

The barrier jet module consists of animations of three different stages in their formation, any or all of which can be displayed at one time. In the first, a parcel approaches a mountain barrier and then rises, expands, and cools, causing it to descend back to its original level. Stage two shows the resulting high pressure center with wind vectors diverging in all directions. Where the Coriolis effect can act, the vectors turn and mainting their original length, but where the mountain range is right of the flow the vector lengthens and increases in speed. Since the mountain range curves in front of the barrier jet, the final stage shows rising air and the formation of a cloud and resulting snowfall.
Currently, MountainMetCube consists of three modules. The third illustrates the principles of topographically forced Rossby waves. In one mode, a smooth globe with circular height contours is topped by a cylinder moving in geostrophic balance. A vertical line on the cylinder shows that it is rotating when the user leaves the globe fixed, but appears to have none when the globe is rotated. When the other mode is chosen, a ridge appears in the cylinder's path. As it ascends, its height decreases, area increases, and begins to rotate in the opposite direction of its planetary motion. As a result, the contours form a wave pattern around the entire globe.

RadarMetCube
Radar meteorology also involves concepts of motions in the vertical affecting those in the horizontal. The mesocyclone in a severe thunderstorm draws in cyclonically-rotating air at lower levels resulting in a characteristic velocity couplet. However, to conserve mass, the flow at the top of the storm diverges in an anti-cyclonic direction and produces a different couplet. Another Merge Cube application called RadarMetCube will be able to show this simultaenous horizontal and vertical motion and the resulting radar scans at each level.
The AR environment can improve upon standard textbook diagrams in other manners as well. While a 2D plan view may be sufficient to show a particular type of motion or travel, if there are many possible results depending on the prevailing conditions, it can be difficult to match the various figures with all of the descriptions in a caption. In the beam propagation module, a radar site is located at the intersection of air masses ahead and behind of a dryline, ahead of a warm front, and behind a cold front covered with snow. Users can toggle the display of the fronts and snow cover and skew-T profiles which would be expected in each quadrant. When a beam is fired in one direction, users will see the effects of standard refraction, super-refraction, sub-refraction, and elevated ducting.

More in-line with the Merge Cube's advertising of holding an object in your hand, the dual-polarization module contains enlarged graphics of ice crystals, large and small rain drops, snow flakes, and hailstones. Animations of horizontally and vertically polarized radar beams and scatters will illustrate the expected behavior of dual-pol variables in several situations. The large rain drops will show higher ZDR and LDR than small drops and tumbling hailstones and snow. Also, the reorientation of ice crystals preceding lightning strikes will result in negative ZDR values.

MountainMetCube and RadarMetCube both currently contain early versions of three modules. The geometry of the Merge Cube (or a later specialized reference image pattern) naturally offers a natural extension of the menu to include three more modules. Eventually, these two programs could be combined with four others in a main menu. Even further into the future, the initial menu of a MetCube program could contain more general options such as CoreMetCube (dynamics, physical, synoptic), ObsMetCube (radar, satellite, in-situ), and AppliedMetCube (mountain, tropical, fire, air pollution meteorology, etc.).

